Epidemic graph diagrams as analytics for epidemic control in the data-rich era
Abstract
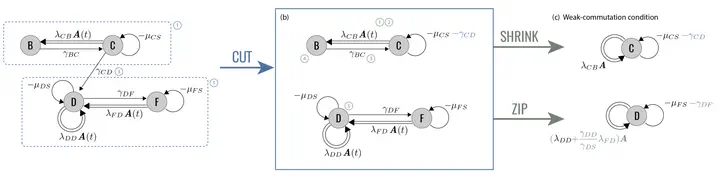
COVID-19 highlighted modeling as a cornerstone of pandemic response. But it also revealed that current models may not fully exploit the high-resolution data on disease progression, epidemic surveillance and host behavior, now available. Take the epidemic threshold, which quantifies the spreading risk throughout epidemic emergence, mitigation, and control. Its use requires oversimplifying either disease or host contact dynamics. We introduce the epidemic graph diagrams to overcome this by computing the epidemic threshold directly from arbitrarily complex data on contacts, disease and interventions. A grammar of diagram operations allows to decompose, compare, simplify models with computational efficiency, extracting theoretical understanding. We use the diagrams to explain the emergence of resistant influenza variants in the 2007–2008 season, and demonstrate that neglecting non-infectious prodromic stages of sexually transmitted infections biases the predicted epidemic risk, compromising control. The diagrams are general, and improve our capacity to respond to present and future public health challenges.